The F1 Score: Time Series Model Championships
With the British Grand Prix just around the corner it's a GO, GO, GO as we launch our Formula 1 themed Time Series Model Championships. Yes, that's right folks, us at the totally not made up Federation Internationale de Time Serie (FITs) are promoting, for literally no prize whatsover, a championship where we pitch model against model in a series of 40 Sans Prix. All this to see who comes out on top as the best time series model based on the Monash dataset benchmarks. To see all the results and analyis head over to the F1 Score Time Series Model Championships website.
The Idea
The good folks at Monash University in Australia have been benchmarking time series models for a while now and publish their results on the Monash Data Respository. They have collected and curated a huge number of datasets from across the field and then run a number of models on them to see how they perform. Then they publish the results of various error metrics such as the Mean Absolute Scaled Error (MASE), and the Symmetric Mean Absolute Percentage Error (SMAPE). Now, we're going to take these results, rank how each model performs based on the MASE metric and then award points according to the Formula 1 scoring system.
Entries
So the models that Monash have benchmarked are as follows and can broadly be categorised into three groups:
The models currently in the championship
With the exception of Prophet which comes from Facebook the statistical models are taken from the forecast package in R.
The Neural Network models were run using the gluonts package in Python with the exception of Informer the source of which is not stated. Informer has only been benchmarked on a few of the datasets so it's at a disadvantage in the championship, but I have included it so that we can see how it performs on the datasets it has been run on.
The other models were run using packages in R. Catboost is a well known ensemble method and PR is (Pooled Regression) is based on Principle Components Analysis (PCA).
Calendar (Datasets)
So our competitors will have to navigate the bends and straights of 40 out of the 42 datasets from the Monash benchmarks. They come from a variety of fields such as finance, retail and energy and also have different frequencies from 10 minutes up to yearly. Some of the datasets are univariate and some are multivariate, however they have only been benchmarked as univariate. Kaggle Daily and M4 Yearly are excluded as these haven't been benchmarked across all models. Each dataset specifies a forecast horizon over which the models are required to produce forecasts. This allows us to make fair comparisons across each dataset.
The Error Metric
We are going to use the MASE as the error metric which is the metric used on the Monash website. Broadly speaking the MASE is a scaled version of the MAE with respect to a seasonal naive forecast. So I like to think of it as a measure of how much better a model is than a seasonal naive forecast. Any number more than 1 means the model is worse than a seasonal naive forecast.
Scoring System
| Position | 1st | 2nd | 3rd | 4th | 5th | 6th | 7th | 8th | 9th | 10th |
|---|---|---|---|---|---|---|---|---|---|---|
| Race | 25 | 18 | 15 | 12 | 10 | 8 | 6 | 4 | 2 | 1 |
Regulations
The deep learning models are all run with a common default set of hyperparameters, meaning that there is no tuning of the model to the dataset. The one thing that does vary is the number of lag variables, which GluonTS automatically determines based on the frequency of the data.
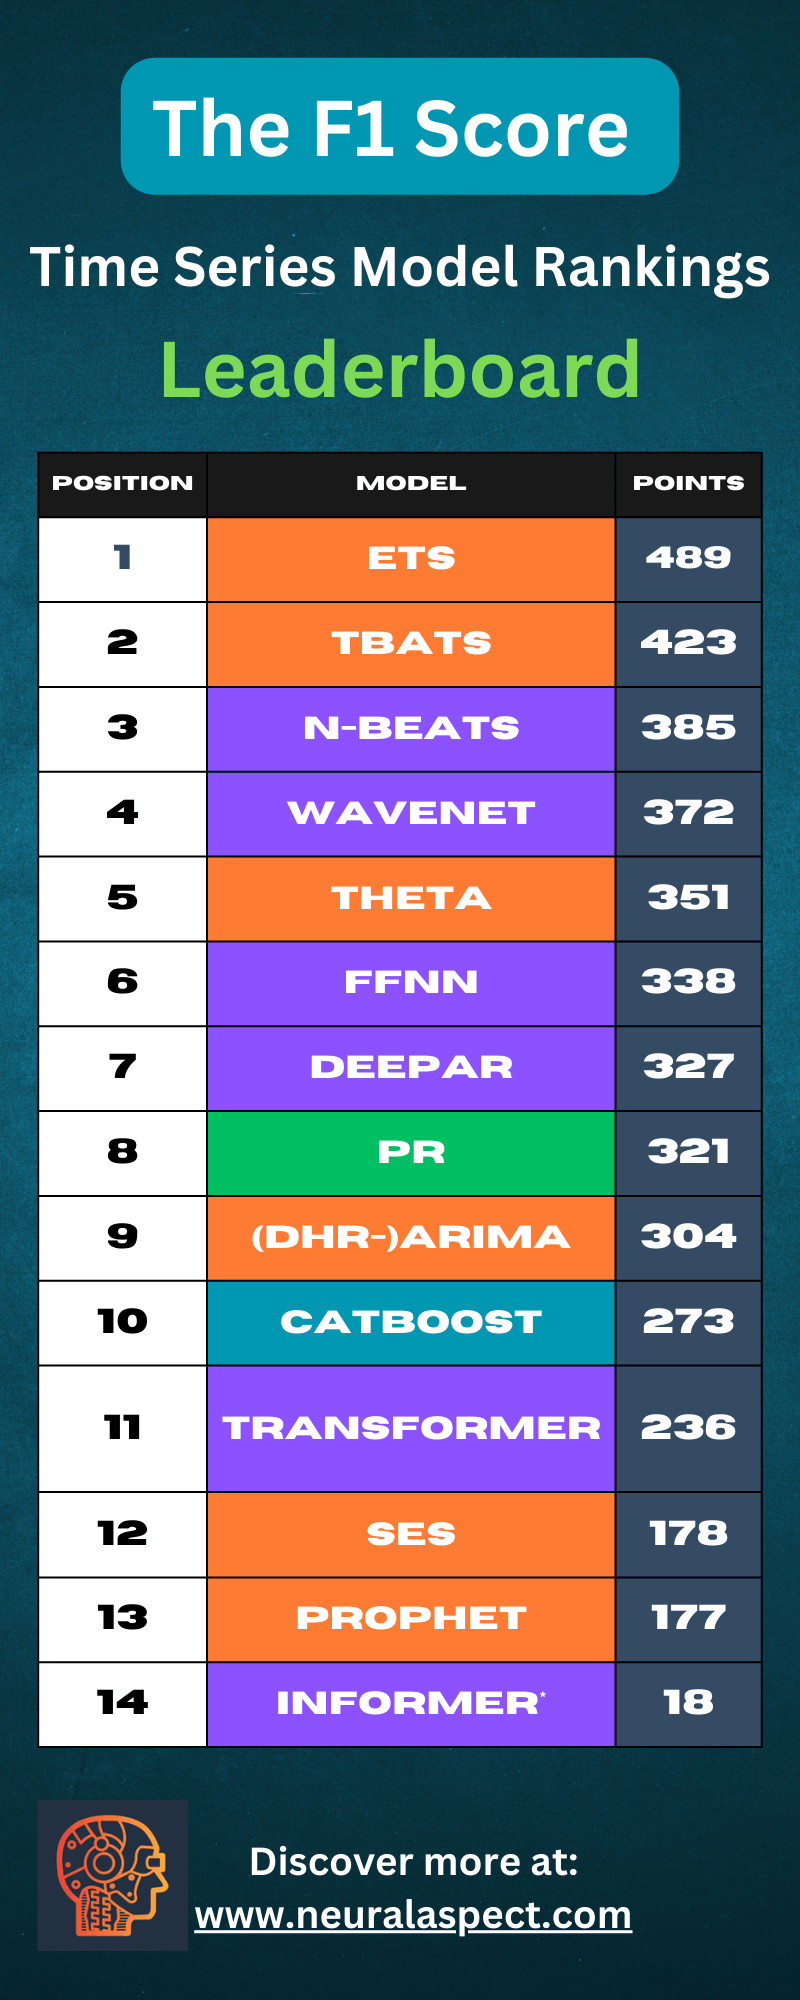
Results
Ater 40 rounds of the championship the current standings are as follows:
What's the Point?
So actually there is a serious point to all this. I think in our field of time series forecasting we need be more transparant about how models perform. I see a lot of papers where a new model claims to have achieved state of the art results and yet the authors have benchmarked their model using a different metric, or they've normalised the data before hand, or they've used a different forecast horizon. This makes it very difficult to compare models and to help our understanding of which perform best in which situations. By using common benchmarking datasets and metrics we can start to address this issue.
What's Next?
Over the coming months I will be doing some benchmarking of my own and will be adding the results to the leaderboard. If you have any suggestions for models to include or datasets to benchmark then please let me know. I will also be adding some more analysis to the website so stay tuned for that. In the meantime head over to the F1 Score Time Series Model Championships website to see the full results and analysis.